Draw a Mobius Strip with Python
First of all, we need to figure out the Math Analytic Expression of the Mobius Strip.
Math Analytic Expression
You can easily get this expression if you have a good command of Analytic Geometry.
If you don’t know how to get the expression, you can search on google.
When it is classic Mobius strip, then .
Substitute the in the expression, then you can get this expression:
Draw with Matplotlib
We are going to draw the Mobius Strip with Numpy and Matplotlib.
- import the dependencies and set the parameters.
import numpy as np
from numpy import pi,cos,sin
from matplotlib import pyplot as plt
from mpl_toolkits.mplot3d import Axes3D

R,W=10,10
a,b=24,20
- define the Analytic Expression.
def x(u,v):
    return (R+v*cos(u/2))*cos(u)
def y(u,v):
    return (R+v*cos(u/2))*sin(u)
def z(u,v):
    return v*sin(u/2)
where u,v represent of and
- calculate the Meshgrid of the graph.
u_range = np.linspace(0,2*pi,a)
v_range = np.linspace(-W/2,W/2,b)

uv_meshgrid = np.meshgrid(u_range,v_range) # build the meshgrid of parameter

X,Y,Z = map(lambda f: f(*uv_meshgrid),(x,y,z)) # calculate the meshgrid of the mobius strip
- draw with matplotlib.
fig = plt.figure()
ax = fig.gca(projection='3d') # instance of 3d canvas
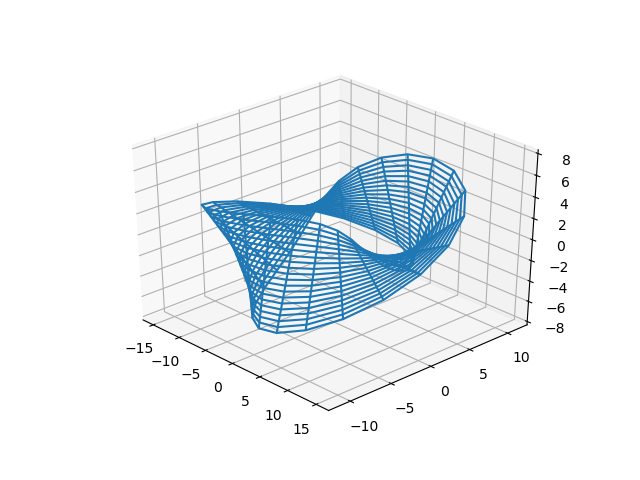
ax.plot_wireframe(X,Y,Z) # plot the wireframe of the mobius strip
plt.axis('off')
ax.set_zlim(-.8*W,.8*W)
plt.show()
the output:
Draw with Sympy
We are going to draw the Mobius Strip with Sympy.
Sympy is a Powerful Python library for symbolic mathematics.
Let’s coding
from sympy import *
from sympy.abc import r, theta, beta, omega
from math import pi
from sympy.plotting import plot3d_parametric_surface

x = (r+omega*cos(beta))*cos(theta)
y = (r+omega*cos(beta))*sin(theta)
z = omega*sin(beta)

R, W = 10, 10

x, y, z = map(lambda expr: expr.subs(
    [(beta, theta/2), (r, R)]), (x, y, z))

plot3d_parametric_surface(x, y, z,
                          (theta, 0, 2*pi), (omega, -W/2, W/2))
the output:
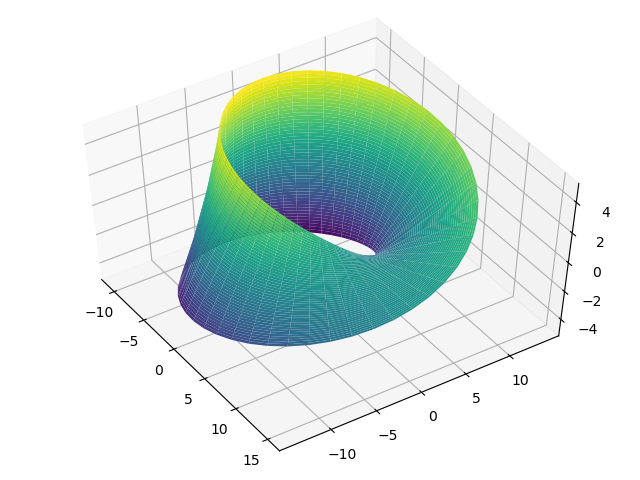
You see the code with sympy is more compact and symbolic than using mumpy and matplotlib
For FUN
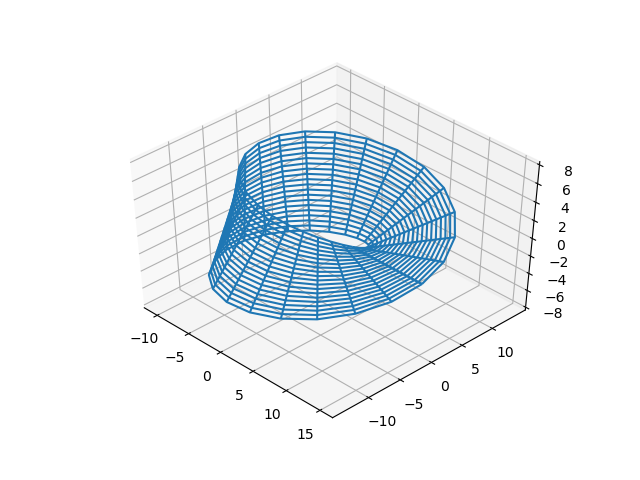
You can try to modify the expression of .
When
the output will be: